Digital Marketing - Study Notes:
What is data?
What do we mean by data in its core essence? So the definition is, “Data is information in raw or unorganized form such as alphabets, numbers, symbols that refer to, or represent conditions, ideas, or objects.”
Now, ultimately, thinking about it across the spectrum of what data means is very, very valuable. Think about this across your core dimensions of qualitative data, as well as quantitative data.
Types of data
So qualitative data is effectively a depth of insights that you get which are more qualitative in nature. They are not necessarily numerical, but they are core insights that are say captured through methodologies like interviews, for example.
On the other hand, you’d have more codified types of data in the form of quantitative analysis. Now thinking about quantitative analysis could be anything from thinking about your management information that you have with the core of your organization. Think about sales figures is a great one, or number of complaints is another interesting one to look at. You can also look at data in terms of a customer journey flow.
So think about the bottlenecks that exist within your customer journey and understand how many people, say, “drop off” when thinking about a customer acquisition journey at different stages. Codifying the bottlenecks within a journey can provide extremely useful insights for you and your organization about where exactly you need to focus your efforts to make changes and ultimately, increase the bottom line.
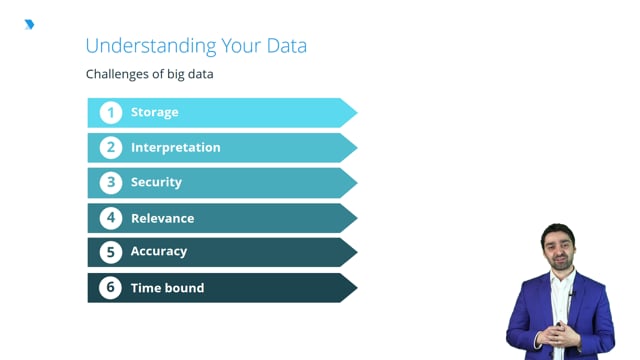
Challenges of big data
Advent of big data
Now, thinking about the world of big data, in essence, there’s a great quote out there that says, “In the last two years we’ve created more data than we ever have in times gone by.” The advent of big data has become one of the fundamental changes to the way that we view the world, and also organizations start to collect and actually make decisions from it.
But let’s think about what big data is to begin with. Well, ultimately it’s a coming together of multiple datasets both from your internal sources within the organization, as well as matching those up with external sources. So overlaying the external information and insights become very valuable at adding more color to your current operation or current way you do things.
There was a great TED talk on this which talks about what was America’s favorite pie? Ultimately, people always assumed that it’s apple, and yet when you start to dig down into the sales figures, particularly during the advent of smaller, bite-sized pies in the American marketplace, we’ve come to the realization that actually apple was the biggest compromise for American families; and their favorite pie was, in fact, another pie, whilst apple came in at number two.
So you can just see narrowing and meshing across different sets of data and the depth of data that you go into becomes interesting to understand different insights that you may have.
Challenges
Let’s think about some of the core challenges that exist when thinking about big data.
- Storage: Think about 15, 20 years ago when you’re probably walking around with floppy disks which probably held a couple of MB worth of memory. In reality, today, we have cloud-based storage which almost can be infinitive. But when it comes to big data, the amount of data capacity is always going to be an inhibiting factor when trying to marry different sets together.
- Interpretation: A lot of people say sweat the numbers hard enough, and it’ll tell you exactly what you wanted to hear. And that’s kind of true in many ways. With the abundance of data, we can pretty much try and manipulate it the way that we want, and in actual fact, to get it to tell the story that we want as well. So organizations have to be very, very careful about being true to the understanding of what the data is saying, and not actually search too hard or make assumptions about what the data is trying to tell us. Ultimately, that just leads to falsehoods and that’s one of the big issues with big data.
- Security: Now, if you think about big data and the world of where is it coming from, think about the social landscape where data is collected all the time from social media. This is becoming quite a fundamental issue both in terms of privacy, but also more so in being able to store the data and make sure that it doesn’t get into the wrong hands. We’ve all heard of great examples where data is actually compromised, then it starts to be leaked across to people who then steal it for fraudulent purposes, and so on. So we’ve got to get much smarter with the way we store and secure our data.
- Relevance: Data links back to the six points around time boundness, but because of the abundance of so much data, it becomes irrelevant much sooner than ever before, as well. So we’re going to be very mindful about exactly how quickly we can translate and use that data for meaningful purposes in the organization. In reality today, real-time is actually becoming quite a thing that people expect, particularly consumers, so we need to react very quickly.
- Accuracy: How accurate do we make the data, and is it capturing all the multitude of factors and variables that we wanted to? Now this is an interesting area particularly when an organization starts out on that data journey; they tend to focus on a few key variables. Now, for example, having worked in insurance, we used to focus when coming to, say, retention, on the amount of uplift in price for one year to the next, is a key classic variable to determine whether someone is going to stay or leave. Now what we didn’t realize at the time was there’s a host of other types of variables; things like the channel in which you acquired in the first place is a very big area, as well as the amount of claims you may have had during the course of the year. So it’s about being realistic in the way that you accurately combine all these various variables to create something that actually makes sense for your organization.
- Time bound: Make sure that you use the data quickly, almost in real-time, is probably becoming the main thing. Now largely speaking organization systems inhibit the ability to do that. So you need to think about quick fixes, and there lots of third-party solutions out there that will actually respond in real-time to reactions by customers and create automated triggers that help you to become more relevant when you’re putting your message out there.
Key misconceptions
Now, let’s think about some of the key misconceptions that you have when thinking about your data.
Emphasis on large data sets
Why is that? It comes back to statistics. If we have a larger dataset, it means we can get more meaningful results. Let’s go back and think about the core of the definition of data. Sometimes having a massive pool of data sets actually can be more complex and confusing than, say, getting a few key qualitative insights that you can then lean on around to make up key decision making. The common phrase around analysis paralysis is normal or true when it comes to data analysis here. So think about that; and you don’t necessarily need to focus on massive datasets, although in most cases it needs to be robust enough that you’re gleaning generalized results out of, and not basically skewing the results for one specific population.
Time will tell
That is a longitudinal type of aspect to data. Now we talked about the need for accuracy, and relevance, and time boundless; and on the flip side, you talk about historical data. And in reality, historical data may be less valuable to us. Think about some of the key macro trends that happened over the last year. Who could have predicted these things? So, in reality, relying on data that are years past may not be the best predictor of the way things are going to happen in the future. We should be quite cognizant of that as we move forward with this.
Correlation equals causation
Correlation is effectively when one thing happens, another thing tends to happen. So the factors are correlated together. Now the problem with that is you don’t quite know which way around it happened; whether you’ve made the change and then the customers have responded, or something happened within the customer psyche which then influenced that change. So you don’t know the area of causation. So you must be very careful when analyzing data not to make assumptions about causation, although correlation is the first step. And then you need to work out what the causation effect is. So you need to be conscious of that dynamic.
Context is key
Context is another massive misconception that we tend to find within data. And essentially it’s trying to look at data through too much of a narrow lens. So context is absolutely critical and context is key, as the slide says, to make sure you’ve got the best picture or a holistic picture around what the data is saying to you.
Percentage vs percentage points
Percentages and percentage points are completely different. Percentage is effectively the movement between the previous set of the previous results, and what the change was the difference being is the percentage, while percentage points is the movement. We need to be conscious about that because you get stuck with different results if you just look at percentage versus percentage points.
The average trap
Ultimately when you have large sets of data, people try and glean to what is the average of what that data is telling you. The problem with average or median is you don’t truly understand what’s happening at the pool or the pools, so you might miss out on vital insights or you might miss out on what the data is really telling you if you constantly go just back to the average. The best thing to do to avoid that is to unpick the data, create micro-segments within your data, and analyze key variables in isolation, and also think about standard deviation. Now standard deviation is effectively looking at the average point and then determining how far are the extremes in terms of the deviation from the average. The further or the highest standard deviation, you know your data is far more skewed and you then have to start to think about something beyond the average point. If the standard deviation is very, very narrow then in reality, the average becomes more reliable.
So you need to think about a variety of different things, and these are just a few key watch out to make sure that you don’t fall into the key issue around data traps and misconceptions when analyzing you’re analyzing your data.
Consider this question: What does the average US citizen spend on? Effectively, if you take the averages, the average won’t reflect the full range of the data in effect. It also may be skewed by a group of anomalies. If you have someone who is spending an enormous amount of money in one area, the average will automatically be skewed to that particular area. You will then start to think that the average is actually much higher or much more skewed in one area than it actually is for the generalizable population. So you need to think about that when considering this. And standard deviation, as I mentioned before, is a great way to kind of overcome some of those core biases that you effectively see within this data.
Back to TopRichie Mehta
Ritchie Mehta has had an eight-year corporate career with a number of leading organizations such as HSBC, RBS, and Direct Line Group. He then went on setting up a number of businesses.