Digital Marketing - Study Notes:
Linked data
Linked data is a method of exposing and connecting data on the web from different sources using hyperdata links, much like hypertext links to allow people to move from one document to another. And linked data could be helping a customer through a journey through multiple data sets and different websites or it’s linking the data sets at the back end maybe from transactional data to complaint data to customer service data. It’s all about linking these different things together to get a richer understanding about where your customers are going, what are they doing, and what the key bottlenecks within the journey that you’re trying to solve for, which can then deliver you tangible value.
Delivering value
And tangible value’s not just commercial value, it’s customer value as well, it’s regulatory value, and it’s keeping above board with security considerations. All these things become very important and pertinent, and linked data is the key to be able to get you to do that.
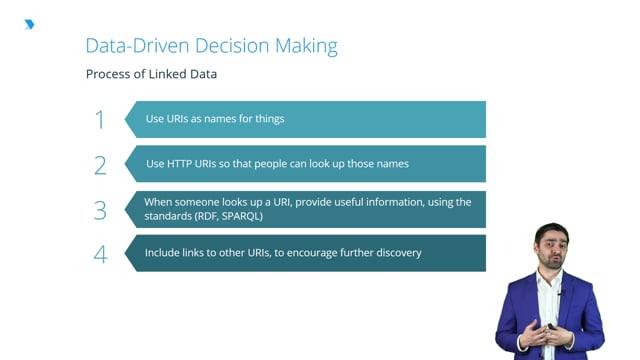
Process of linked data
What are some of the key considerations around process of linked data?
You should use uniform resource identifiers (URIs) as names for things, and use HTTP URIs, so people can look up those names. When someone looks up a URL and provides useful information, using the kind of key standards that were used in the past.
These things may be intuitive to some of you who use this type of stuff on a daily basis. But if not, these are fundamental things to get right from the outset. Include links to other uniform resource locators (URLs) to encourage further discovery. All of these key things are very important when trying to create a robust, comprehensive journey for your customer.
Semantic technologies
Semantic technologies are things like auto-recognition of topics and concepts, information and meaning extraction and categorization. All of these things are effectively drawing similarities within your data, within your content. They enable you to label up and badge things in a meaningful way for your customers, so they can navigate things much more easily than ever before.
- Auto-recognition of topics and concepts: You might be a content-led business. Think of the likes of Facebook, or of LinkedIn, for example. They’ve all categorized things through tags. It enables people to get to your data quicker.
- Information meaning and extraction: This in turn enables people to pick up relevant things that are interesting for them in a meaningful way and quicker as well. Information and meaning extraction become quite pertinent.
- Categorization: Categorization involves tagging this up into different core elements that people can relate to. This becomes very important and an exciting way to go about doing things.
Advantages
What are some of the core advantages of semantic technologies?
- Search information from disparate sources can be categorized in a more easily, readily, and automated way.
- It effectively automatically refines our searches in that respect.
- It forges relationships between the concepts that they help you to predict change, and they’ll do so in an automated way, which actually becomes very useful.
- It builds more transparent systems and communications because it’s creating automated linkages between your different data sets and drawing out different categorizations as well.
The Internet of Things
Let’s now move on to think about one of the most fundamental changes that is taking place in the market. That’s the Internet of Things.
What is the Internet of Things?
It’s a system of interrelated computing devices, mechanical and digital machines, objects, animals or people. It provides you with unique identifiers and ability to transfer data over a network. And crucially, it doesn’t require human-to-human or human-to-computer interaction. It’s effectively when one object starts talk to the other, which starts to talk to the other.
Applications
- Think about ambulance services going down the main street and being able to talk to traffic lights to be able to get you know, when to change at the right time at the right pace as they’re going through.
- Think about the detection of healthcare problems before they happen which alerts the GP to then fixing or to then automatically send out a prescription to solve that problem for a particular patient.
- Think about home automation where you know, the system predicts that you’re about to walk in the door, turns the lights on and turns the heating on for you.
- Think about when you’re running short of milk and a computer needs to just re-order it from the website and it does that. It’s re-ordered and then basically to your door the next day.
It’s all the diverse objects coming together and filling in all these various linkages. The need for human input becomes less and less relevant. It’s the meshing of a number of key fundamental trends and technologies coming together to be able to offer this type of solution. Machine learning is a great example of that. Without a machine being able to identify and understand what’s happening, it will be very, very difficult for this to basically to take place.
Considerations
What are some of the key considerations to make when thinking about the Internet of Things?
- Embedding objects: You need to be able to put intelligence into certain objects for them to make it meaningful.
- Location of living things: Electronics is a great example, whether it’s chipping of human beings, whether it’s GPS locations on your mobile, whether it’s patient input, or whether it’s Fitbits in your health tracking devices. It involves building and inputting key technologies to be able to monitor and then do something about that monitoring all those insights in real-time from one object to another.
- Software: It also needs a lot of software in the backend to make that decision process for you. Updating that software is actually critical. Consider Fitbits and health evaluations. When that software links your Fitbit data or hardware data to your GP’s data, that becomes quite a meaningful thing when you use it to make predictions about who is more likely to do certain things or fall ill or whatever that may be. You can use software as a means to get an additional richness within your data set.
- Sensors: The sensor could be in your home or in your car. Think about driverless cars and the number of sensors that it would have, or when you’re walking in the door and it tracks your movement through your mobile. Using sensors enables the intelligence to be activated at certain points within that journey, so you need to have those sensors at appropriate locations. RFID is a great sensor that’s likely to take place across the retail environment. And a good example of this is that of Argos. Argos is basically predicting an onwards vision to get the customers out within three minutes of walking into the store. And one of the key ways they’re thinking about doing that is by having sensors at the door which predicts when customers are about 50 meters away, so the store can get the items that they’ve ordered online ready for delivery.
- Network connectivity: It’s no use having these networks in silos. You need to basically have the entire network connected together to be able to understand how the linkages work. And so that’s why it’s important to create this connectivity.
Internet of Things applications
Applications include smart homes, smart cities, wearables, and connected cards. Consider how these various aspects and trends and applications actually might fit into your businesses. And how you might apply some of these technologies and capabilities, to what you’re trying to achieve as an organization.
You won’t have to search very far to think about how the Internet of Things will impact you in the future. A great example is that of the connected car. Think about a world where you have a driverless car. What’s the role of motor insurance? You don’t have any accidents anymore. The number of accidents has gone down dramatically. So, in reality, all of these things will, particularly the Internet of Things, can fundamentally reshape how industries’ and organizations’ business models have operated for the last number of decades.
Data visualization
Data visualization helps to make big data understand using patterns, trends, correlations that might be undetected in text-based data and be exposed and unrecognized.
Consider a word cloud or infographics. These are visual ways to help you interpret and identify key trends that you’re seeing within your existing data set. This becomes important because to go back to the Rory Sullivan quote “there’s so much dross out there”. You can pick out the golden nuggets that you need through that visualizing perspective.
Advantages
Tableau is a great example of a visualization software that anyone can use. It’s a SaaS based tool.
What are the advantages of data visualization?
It gives you the ability to visualize relationships between operational and business activities. Data visualization is a way to try and map out and join the dots across your business. How do, for example, the operations team and KPIs actually start to impact and influence the key business critical activities and strategies you’re trying to drive as a business? Having that in a robust, neat format across even a one pager helps the organization to move forward and understand what you’re trying to achieve.
Simplicity is key within these data environments. Data visualization can help you to start to galvanize people to your strategy. And it also helps to identify and act on emerging trends faster. If you can see it plain on a page, it’s going to create an organizational emphasis to be able to make that done in a more robust way. Sometimes you have to trudge through mega spreadsheets to try and patch things together. And it would be much easier if you had one slide where you could’ve understood what the key nuggets were. And that would’ve both saved time, but also saved organizations from going into flux. Organizations sometimes can’t make decisions because they don’t have access to the key data sets.
Data mining
Data mining is the process of analyzing data from different perspectives and summarizing it into useful information. It is primarily used by companies with a strong consumer focus. In essence, think about the traditional sense of what mining is all about. It’s about going deep into the heartland of something to figure out, or get something more valuable out of it.
You’re digging further down the data to understand the core insights. What is in the data? What’s the data telling you? And then how can you, once you’ve understood that, generalize across a certain population around that?
Determining relationships
Data mining involves determining relationships among internal and external factors.
Internal
Internal factors include relationships around pricing, around positioning, and around staff skills. Pricing is an important one because you need to know how much you want to charge.
A great campaign was done by an insurance company in the UK, where they asked customers how much they want to pay for a premium and gave them or made a tailor-made product based on the price they wanted to give. What was amazing about that was they were able to mine and understand different segments had different price points and different quality products that they wanted to have. They were able to gain a rich understanding which they could then draw up on to make further pricing decisions in the future, once that camping was over.
External
These include economic indicators, competition, the marketplace, and demographics. If you could mine data to understand competitive activity, you can get ahead and build propositions that reflect what you’re trying to do as an organization and gain a differentiation from them.
Descriptive data analytics
Descriptive data analytics involve brief descriptive coefficients that summarize a given data set in which you could either have a representation of an entire population or sample of it. It comes from two things:
- Measures of central tendency: These include things like mode, median and average.
- Measures of variability: These include things like standard deviation.
And what you’re doing here is you’re trying to make assumptions or come up with conclusions around what the data is telling you. You’re interpreting the data in certain ways. You need to use both together to come up with robust findings and understandings. If you don’t do that, then you’re probably going to miss a trick and you’re probably going to miss some of the core insights that are what that data is basically telling you.
Back to TopRichie Mehta
Ritchie Mehta has had an eight-year corporate career with a number of leading organizations such as HSBC, RBS, and Direct Line Group. He then went on setting up a number of businesses.