Digital Marketing - Study Notes:
Associated technologies
Now, let’s think about where big data has come from, and some of the key associated technologies around it. There’s been more data that’s starting to come to the forefront than ever before. As a consequence of that, we have the ability to mesh different datasets, to create core insights and understanding about our customers and environment than we’ve ever had before.
Now, as a consequence of doing that, it’s the coming together of a number of different tools and techniques. Some of these key technologies in this area is around predictive analytics. Being able to use the data to understand how things may happen in the future.
- Data quality software: We talked about the role or the need to deduct that data to cleanse the data, to make it more viable when considering what insights we can use.
- Integration tools: We need to put together a number of different integration tools. Think about this in two core dimensions. The first is internal tools, or internal datasets. And the second thing is around external datasets, bringing together the data that you get from external environments as a way and a means to be able to integrate it with your internal data.
- Data virtualization: How do you then represent that data to create valuable and meaningful insights? So virtualization becomes extremely important, not just in getting insights, but also to convince your organization that it’s the right strategy to go down.
- Distributed file stores: Where do the files get stored? Are they on cloud-based servers? Clearly there’s a range of different ways, places, and means from your own servers as well to be able to put and to store this data.
- In-memory data fabric: How does the memory work? How do we create updates within this, and how often do we do this? One of the big advantages of big data is the ability to hold longitudinal data – in other words, data that’s timely. You can have it across a number of years. But clearly the limitations, and we need to make key judgments about what we store and what we don’t.
- Stream analytics: How do we then create an analytics tool to be able to dissect and disseminate some of these core pieces of information? What type of data are we actually looking for to actually put out there, and what would be meaningful to us? A
- NoSQL databases: You can use things like SQL databases or NoSQL databases as a way to try and collect the information and analyze the information.
- Predictive analytics: You can make judgments about things like predictive analytics. In other words, predict what’s going to happen in the future.
And you can just see there’s so many key components that feature into big data analysis. It becomes quite a complicated beast to uncover. And it’s very important that you start small, and you start by thinking about the right type of questions, which is some of the things we touched on in the first section. And then we want to think about how to collect these type of information. How do you bring them together? How do you integrate these core elements of your data?
Key definitions
Stream analytics
Srream analytics is a software that can filter, aggregate, enrich, and analyze a high, you know, a throughput of data from multiple disparate live data sources in any data format. This is a really dynamic way of thinking about analytics functioning. It’s effectively being able to use things in real-time for multiple datasets to make certain level of analysis and layer one over the top, to be able to determine key insights that you may have about your customers. Clearly, it’s important to then respond to that, which we’ll come on to.
Data visualization
It’s technology that delivers information from various data sources, such as big data sources, as well as distributed stores in real-time and near real-time as well. So it’s about translating those raw inputs into something more meaningful. Now, this, in essence, if you’re doing it across one data source, would be quite easy. It’s when you’re overlaying a number of them that database visualization become quite a specialism in itself.
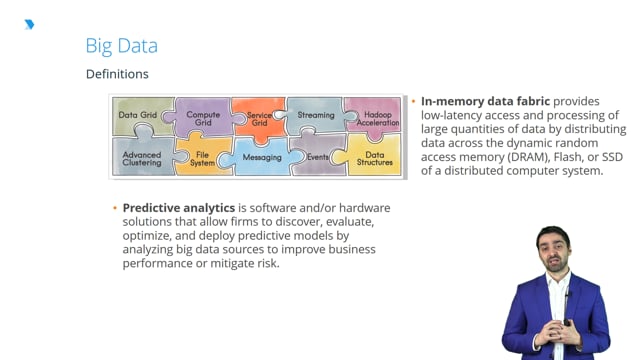
In-memory data fabric
That’s providing a lower latency access and processing of large quantities of data, by distributing data across dynamic random access memory, flash, SSD, or a distributed computer system. It’s basically how you store that data, and then how that data then flows from one different system to the next.
Predictive analytics
All of this then starts to link into predictive analytics. Now, effectively what this is all about, is making core predictions based on far past and previous behavior to evaluate what we think is the likely outcome for the future.
Application to marketing
Now, this is very, very important when thinking about buying behavior, for example in a marketing world. Think about retention behavior, or think about even complaint or claims behavior in an insurance context. We need to be very cognizant about how we make these predictions. Now, the only issue that you have is holding on to the data, and what it says, too rigorously and vigilantly. We need to overlay an element of humanistic judgment into this whole arena. And if you don’t, you will miss out on one vital factor, and that is the future. We need to be intuitive about what exactly is going to happen, the variable that have changed from the past to make certain assumptions about what will then be predictable in the future. If you solely rely on historical data, you effectively will lose the richness of the intuition that you would have in overlay, to be able to understand what would happen in 12 months’ time, two years’ time.
Think of it as a jigsaw. Now, why do we use this jigsaw illustration to think about some of the big data technologies? Well, in reality, it’s all about meshing these together. There’s an element of overlap, as well as linkages that all these various things need to come together to create a robust big data strategy. And if you don’t have these linkages, you’re effectively missing a trick.
The four Vs
Now, when thinking about big data, there are a number of different ways that you can think about this. One of the most useful frameworks that you can think about is that of the four Vs. And the four Vs are volume, variety, veracity, and velocity.
Volume
Let’s start with volume. In order to be or have, you know, the big data in itself, probably intuitive, you need to have a larger number of data sources, as well as volumes of insights on individual customers. It’s the aggregating which basically creates the richness within the dataset. And remember, it’s not across a single dataset, it’s about meshing a number of different data sources. So you’ve got some that feature across the slide.
Variety
The second thing is basically meshing together a different variety of data types and sources. We come back to some of the definitions around structure, semi-structured, unstructured data. And that’s what you basically get in that variety section.
Veracity
Veracity is effectively the need to basically have robust data. Effectively, you have integrity within your data. Make it trusted, make it clean, make it deduped, because any anomalies that you have within it would only hinder the result that you get out of the other side, causing inaccuracies that sometimes you’re not able to pick up later on. Remember, robust inputs equal robust and valid outputs, and this is fundamentally important in big data.
Velocity
We talked about speed, accuracy, if you’re putting too much historical data in there, too much would have changed. You know we talked about the changing nature of things, and the unpredictability of the marketplace. And this is a core facet here that if we don’t get right for big data, we’re going to make mistakes. We’ll start to question the reliability and validity of the data that we basically have, and the insight that we gleaned from that data. So velocity of putting the most current datasets in a dynamic way, and often in a real-time way to input the data is very, very important.
So if you think about the four Vs, a really useful framework to be thinking about how you can structure your big data approach, how do you collect big data in this way, and how do you start to analyze it as well.
More definitions
Statistics
Statistics is all about creating generalizable results using certain datasets. Being able to analyze with certain level of certainty that something is going to occur. You’ve also got statistics as a way to understand correlation versus causation, and they help you to outline that, but also at a more general level, to understand basic interpretations of what the data is telling you.
Advanced analytics
Advanced analytics is the analysis of data using sophisticated quantitative methods to produce insights that traditional approach to business intelligence is unlikely to uncover. So using analytics as a way to make key business decisions is absolutely critical for us.
Back to TopRichie Mehta
Ritchie Mehta has had an eight-year corporate career with a number of leading organizations such as HSBC, RBS, and Direct Line Group. He then went on setting up a number of businesses.