Digital Marketing - Study Notes:
Setting up regular monitoring on Google Analytics
So, in addition to tracking the metrics, what goes into that is setting up regular reporting. So, for the purposes of this section, we're going to talk about Google Analytics specifically. Bear in mind that it’s not the only analytic tracking software that's available.
Create automated reporting and/or custom dashboards
The first thing you can do is create automated reporting. That's basically setting up a PDF or an Excel file that's automatically sent to you at the time interval you choose.
Then, your reporting's already done for you. You don't have to worry about it. All you have to do then is analyze the data. You also can set up custom dashboards. So, basically, when you log into Google Analytics, you can see instantly how your website's performing, based on the metrics that you want to focus on. So, a dashboard can have little boxes of the metrics you want to track, so you can see at a glance, what's working and what's not.
Build a tracking spreadsheet that will show progress
You can also then, build a tracking spreadsheet that's going to show progress, and this is important to share with your team and everyone else that's involved in the project, and then maybe your leadership or management as well, if they want to see how your website's performing. So, a tracking spreadsheet is just going to take that data that you got in Analytics, and break it down. You do this if you want to see a more data-driven approach, instead of the PDF export that comes out from the Analytics.
Examples of website metric monitoring
Example 1
Here’s an example of referral sources from a website.
This is just referral sources from the last 28 days. Google Analytics likes to use 28 days, because the months have different days, number of days in them. So, 28 days is a good metric to compare. So, we can see that the majority of their traffic came from organic search, and then it went down from there.
And Analytics lets you drill down and click on each of those sources so you can see specifically – for example, in social, what percentage was Facebook, Twitter, LinkedIn, or whatever. This is going to help you figure out again, where your referral sources are coming from, and if your website's optimized properly for these sources.
Example 2
Here's an example of a custom dashboard.
This company has an informational product. So you can see, right on the home screen when you log in, how many users there are in the last 28 days, what revenue they've gotten from their website, and this is something you set up in Analytics to track the conversions.
You can see the conversion rate and then the sessions. The sessions are how many overall people were on the site, which is different from page views, which refers to separate pages. Also, it shows how many users are on the site right now. It's useful to see, at certain times of the day, what pages people are viewing on the site.
Create a schedule of metrics reporting and action implementation
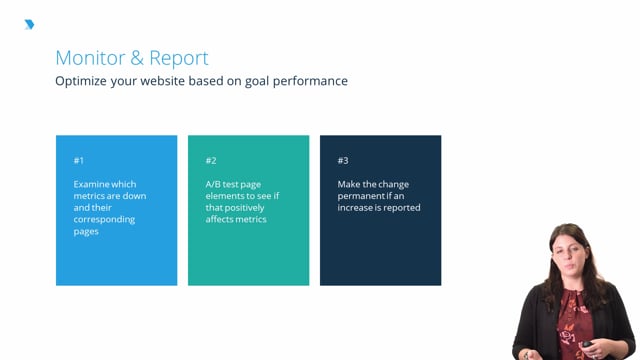
There are three steps in terms of optimizing your website based on goal performance.
Check metrics
So, the first thing you want to do is look at which of your metrics are down, and their corresponding pages. So for instance, if you notice on your overall average bounce rate, it's pretty low, but on your specific product pages, it's a little bit higher, then you know that your product pages might have a problem with your bounce rate.
Test
From there, you can then test and see if you can get that bounce rate lower. So for instance, you can AB test maybe having images on the page, if you don't have any. You can run that test for a while and see if that actually increases the amount of time that users spend on your product pages, and if that leads them to go to other pages on your site. If it did, then you can make the change permanent, and that's going to lead to, hopefully, a lower bounce rate in the future, which is what you want.
So, here's an example of how to set up automated reporting in Google Analytics. You go to Share and this pop up button pops up, and you want to make sure that it's at the view you want. So, maybe it's your custom dashboard or a segment in the reporting metrics. In this example, we just did audience overview, which is just an overall view of how your website's performing, in terms of sessions and page views.
Sharing the metrics
From here, you can figure out whom you want to send it to. Maybe it's your whole team, or maybe it's just you.
Next you prepare the report, and then what format you want. You might prefer PDF because it uses the graphs and it's more colorful. Excel is also an option.
And then, you can also choose the frequency. So, a lot of times, monthly is good enough. But if you want to look at your big picture stuff, quarterly might work better.
Back to TopKelsey Jones
Digital Marketing Consultant and Writer
- 9 years’ experience in SEO and writing for the web
- 17 years’ experience in HTML
- Experience writing content for small and large brands
- US Search Awards Judge 2014, 2015, 2016
- The Drum US Search Awards Judge 2017
- Former Executive Editor, Search Engine Journal, 2014-2017