Digital Marketing - Study Notes:
Twitter Analytics is a section of tools to analyze your tweets and understand your followers.
Within it, there are three main areas to focus your attention:
- Account home
- Tweet activity dashboard
- Audience Insights dashboard
Account home
Account home provides a summary of account activity that provides a 28-day summary for tweets, tweets impressions, profile visits, mentions, followers, and tweets linking to your website if you’re using Twitter cards.
A monthly summary is also providing the same information for any given month.
The Twitter Analytics account home also provides detailed information on how your account is performing, how far you progress, and helpful tips on how to improve your account strategy.
Tweet activity dashboard
The tweet activity dashboard is the interface displaying suite data, such as impressions, hashtag clicks, app opens, link clicks, retweets, replies, likes, shares, and both paid and organic tweets and content.
The dashboard is separated into four sections:
- Tweets
- Top tweets
- Tweets and replies
- Promoted
This can help you see how people engage with your tweets in real time, compare your tweet activity and followers, and see how they trend over time. You can click on any tweet to get a detailed view of the number of retweets, replies, likes, follows, or clicks it has received.
Audience insight dashboard
You can also get detailed insights into who your audience is, especially those that engage with your tweets, and download your tweet metrics for report purposes. The audience insight dashboard provides you with a real-time look at the people who are most relevant to you, such as your followers or people that have engaged with your tweets.
You can learn about your audience’s demographics, interests, lifestyle, and purchase behaviors, and leverage these insights to create the most relevant messages and help you identify new audiences to reach out to.
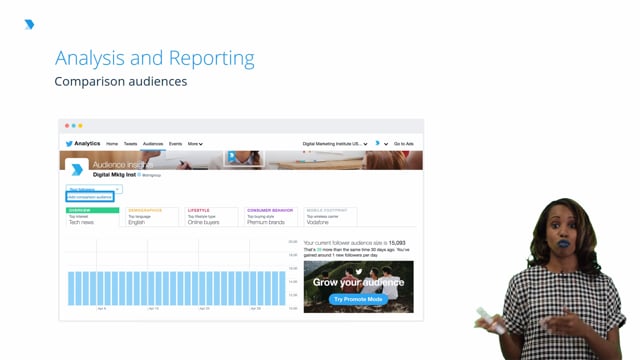
Comparison audience
Comparison audience is a feature that allows you to understand your audience’s interests compared to that of Twitter uses as a whole. To access this feature, click on Add a Comparison Audience underneath your account name, and your audience insights homepage. It lets you hone in on the content that reflects areas where your audience has significant differences from the rest of Twitter users. Using these insights, you can create content that reflects the unique consumer purchase profile and interest areas.
Campaign dashboard
The campaign dashboard is found within the Twitter Ads Manager, and is the place that you should go to gather your campaign data.
When you first open the advertiser interface on ads.twitter.com, you will first be directed to the campaign dashboard. The main dashboard defaults to the summary tab, showing total impressions across all campaigns for the specified date range. You can also view by engagements, spend, and conversions. Data can be filtered by delivery spent, campaign settings, or campaign objectives.
You can export and share your campaign data here, too.
Events dashboard
The events dashboard provides Twitter data on upcoming events and recurring trends.
It gives advertisers a fast and easy way to connect your brand to a live audience, and reach a target demographic that’s actively interested in an event.
Brand hub
The brand hub is used for tracking all your brand’s share of conversation across all advertising channels.
This feature allows you to see the demographics, engagements, and impressions of the audience talking about your brand compared to other brands.
Brand hub is only available to select large advertisers and medium size businesses in the United States. When advertisers log into their ads dashboard, a link will appear under the analytics tab that leads to brand insights.
For those without an ads account, you can just navigate to brandhub.twitter.com. Just note that users must be associated with the handle for that specific brand.
Twitter Cards
Twitter Cards come with a specific set of analytics.
- Snapshot: This provides a whole listing view and how your content is performing on Twitter, showing the number of tweets containing a link to your website or app.
- Tweets: This is the overall data, the larger circles, for tweets, impressions, clicks, app install, attempts, and retweets, and include all tweets containing a link to your website posted by anyone on Twitter.
- Your tweets: This is the inlay data, the smaller circles, including tweets linking to your website which originated from Twitter accounts that you own.
- Change over time: This is a look at how the overall data in your snapshot has changed over time.
- Sources: These are the most common platforms that are used to send tweets that link to your content.
- Best practices: These are where you’ll find personalized tips and suggestions located in the gray boxes on the right, that give you ideas for boosting your performance of your content on Twitter.
Metrics
An important customizable option for reporting is on the campaign metrics view in Ad Manager.
- Click on Metrics Summaries to customize the metrics you see in your dashboard.
- By default, you will see all results, cost per result, and result rate by objective.
- To create a customized metric set, click Customize Metrics, and add as many metrics as you want.
- The metrics will be added to the right side of your table and can be viewed using horizontal scroll.
- Save your metrics set so you can quickly review different reports in the dashboard.
- You can create multiple sets of customized metrics.
- Custom exporting means you can export any view you have created with the custom filters, campaign, and metrics.
- After creating custom filters and metric sets, export exactly what you see in the dashboard, broken down by campaign lifetime, daily or hourly.
- Click on Export. This will save you time and make campaign reporting focus on the right metrics without having to filter the Excel report yourself.
Communicating Twitter campaign data
Once you’ve understood how to use the different analytics tools and can find the appropriate data to determine the success of your campaign, you are now ready to build your reporting.
Reporting can be done for all of your promoted tweets campaign, but also for your overall organic content and profile in order to evaluate what were your successes, where you can improve based on the data collected over a period of time. Campaign reporting is about pulling out meaningful data, analyzing it, and taking action on your findings. These can be used for yourself or presented to your team to give an overview of your brand’s Twitter effort, either organic or paid.
To begin, extract the data that interests you, depending on the KPIs and objective you will have set in the beginning of your campaign, or the objective and the KPIs that you define for your global Twitter strategy. To do so, you can use the Ads Manager dashboard by exporting the filter view that we discussed earlier. Therefore, you can then export only the data that’s important to your specific report.
And for reporting based on your profile and tweet activity, use the relevant analytics and analyze them from the dashboard before gathering the information on your document. Think about who will read this, and what are you trying to get out of it in order to frame the data that you’re reporting on accurately. The key metrics and areas to focus on when creating a Twitter ads report presentation are: deliver KPIs on your overall campaign based on objective, soft metrics such as the number of impressions, engagements of the overall campaign, successful creatives (so which are the types of creatives that were visual assets that were most engaged?), and successful targeting.
What are the audiences that your content was most resonant with based on engagements?
Back to TopSadé Council
Digital Marketing Strategist @ L’Oréal USA
- 11+ years’ experience with brands across fashion, sports, entertainment, financial services, lifestyle & beauty verticals
- Currently advising on digital marketing initiatives for Carol's Daughter
- Expertise in content creation, community management, integrated marketing & influencer relations
- American football fanatic, former full-time ballerina and currently moonlighting as DJ Dae