Digital Marketing - Study Notes:
What Is LinkedIn Analytics?
LinkedIn Analytics is the platform's native reporting tool that can be used to measure the performance of LinkedIn marketing campaigns. It can also be used to generate reports measuring a variety of metrics including connections, search result appearances, number of comments, number of page follows, number of discussions, clicks, site visits, profile views, number of likes, number of shares, number of group members, number of impressions, and finally leads.
Company page analytics
Company page analytics is particularly useful for marketers because it helps evaluate engagement of your individual posts, identify trends across key metrics, understand more about your follower demographics and sources, and finally understand more about your page traffic and its activity. There are three main sections within this tool visitors, updates, and followers. And each can be accessed by clicking the analytics dropdown at the top of your LinkedIn page.
Visitors section
Here you can control the time period the data covers by selecting the timeframe dropdown next to visitors in the upper left corner of the page.
There are two types of visitor analytics you can track in the Admin Center:
- Traffic metrics: This displays key metrics based on traffic to your company page. You can view metrics for unique visitors or page views over time by clicking the page views dropdown in the upper left corner of the page.
- Visitor demographics: This displays a breakdown of who is following your company using five types of demographic data. Use the drop-down menu to the right of Visitor Demographics to filter by job function, country, region, seniority, industry, and company size. This section can help you identify audiences you want to grow with demographic information to more effectively target company updates.
Updates section
In the Update section of the company page analytics, there are three different types of data you can track:
- Engagement highlights: This displays the number of total likes, comments, shares, and new follows in the last 30 days. It also indicates the percentage change from the previous 30 days.
- Engagement metrics: These display key metrics for your organic and sponsored content over time. Use the drop-down menu on the right of engagement metrics to filter by impressions, unique impressions, clicks, likes, comments, shares, followers acquired, and social engagement percentage.
- Updates engagement: This displays engagement updates by individual updates. You can view the following metrics for each update posted to your company page, name, days, target audience, sponsorship, followers acquired, impressions, clicks, city or social actions, and finally engagement.
Followers section
Here there are four main types of data that can be tracked:
- Follower highlights: This displays the number of total organic and acquired followers in the last 30 days. It also indicates the percentage change from the previous 30 days for organic and acquired followers.
- Follower gains: This displays how your number of followers has changed over time. You can view different date ranges and control the time period this data covers by selecting the timeframe drop-down next to follower gains on the upper left of the corner page.
- Demographics: This includes a breakdown of who's following your company using seven types of demographic data. They are country, job, region, seniority, industry, company size, unemployment status. You can filter by each type of data by selecting the dropdown next to the follower demographics.
- Companies to track: This lets you see how your followers compare to other similar companies. You can view the following metrics for the companies, their total followers, their follower growth, their number of updates, and finally their social engagements.
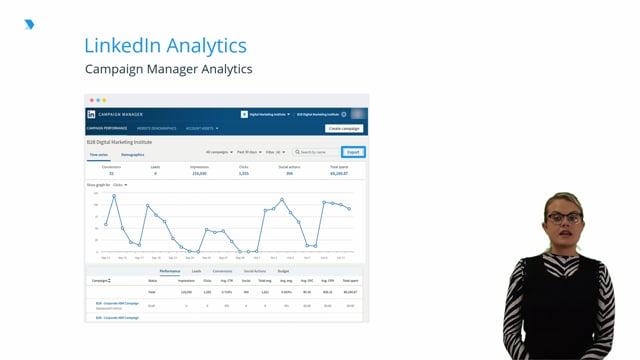
Campaign Manager analytics
Campaign Manager provides performance metrics to help you measure the effectiveness of your ad campaign. These metrics can be seen in Campaign Manager when viewing your campaign. They can also be downloaded as performance reports.
Some metrics will not be shown if you are not running that particular ad format or do not have that particular feature enabled. For example, if you're running sponsored content ads you will be able to see social action data. If you are running sponsored InMail ads you will be able to see sends, opens, and others InMail metrics. If you have LinkedIn conversion tracking setup, then you will see conversion metrics.
To download a performance report, select one of the options from the export button in the top right of the page. You can filter performance by date ranges or choose a custom date. This report provides campaign performance. These are daily metrics for all campaigns in the account. Ad performance. These are daily metrics for each creative across all campaigns in the account. And Click Intelligence. This is a summary of who's clicked on your campaigns. Data in this summary is based on your targeting filters.
Back to TopLauren Murphy
As Head of Social Media for the creative agency Goosebump, Lauren’s current role is to create and implement social media strategies and content strategies for a portfolio of clients spanning a wide range of industries. Her team of creatives and strategists specializes in delivering innovative and integrated social media campaigns that drive conversions. Her work has been recognised with a wide range of awards, including the Irish Social Media Awards and Digital Media Awards.


