Digital Marketing - Study Notes:
Viewing campaign performance
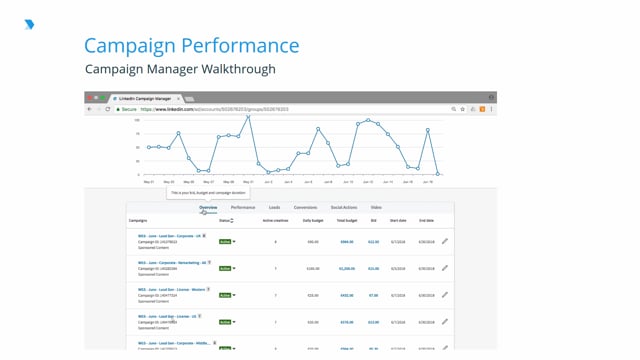
When in Campaign Manager, there are six different tabs you can use to view your campaign performance, depending on the objective of your campaign:
Overview
The Overview gives you a bird's-eye view of your campaign. Here you can see the campaign, the status, the active creative, the daily budget, the total budget, the bids, the start dates, and the end dates.
Performance
These stats track how well your ad is going. Use these metrics to compare your ad success with other ads. We can see the status, the impressions, the clicks, the average click-through rate, the total engagements, the average engagements, the average cost per click, the average CPM, and then the total spend.
Leads
This allows you to view leads that are collected from LinkedIn members submitting their information. We can see the status, the number of leads, the lead form opens, the lead form completion rates, the cost per leads, and then the total spend.
Conversions
We can see the status, the number of conversions, the post-click conversions, the view-through conversions, conversion rate, cost per conversion, total conversion value, return on ad spend, and then the total spend.
Social Actions
These are the social gestures initiated by LinkedIn members. We can see the status, the likes, the comments, the shares, the follows, any other clicks, like comments or see more descriptions, and then total social actions.
Video
We can see the status, the amount of views, the percentage view rate, the eCPV, views to 25%, 50%, 75%, and then complete video views.
Then we can see a breakdown of the completion rate, as well as full-screen plays.
Graphical options
LinkedIn also allows you to view your key metrics within a graphical format.
The following metric options are available for you to view in this format:
- Impressions: This is the number of times people saw your ad.
- Average CPC: This is the total you spent on your ad divided by total clicks to your website.
- Average CTR: This percentage shows how often people go to your website because they saw your ads.
- Average CPM: This is the total you spent on your ad per 1,000 impressions.
- Conversions: This is the total number of times people took a desired action after clicking on or seeing your ad.
- Average cost per conversion: This is the average amount you spent on each conversion. This is calculated by the total spend divided by conversions.
- Leads: This is the number of leads generated from your Lead Gen Form campaigns.
- Total spend: This is the amount you spent on clicks and impressions for your ads.
LinkedIn Website Demographics
LinkedIn Website Demographics is a free reporting tool in Campaign Manager that is available for LinkedIn ad accounts that have the LinkedIn Insight Tag added to their website and have website audiences created. This tool allows you to gain valuable audience insights like job titles, company names and industries, using the most accurate professional data only on LinkedIn.
You will be able to compare different pages to learn which kinds of content resonate with different audiences. Customize content to your strongest prospects and learn what personas are more likely to become qualified leads.
Back to TopLauren Murphy
As Head of Social Media for the creative agency Goosebump, Lauren’s current role is to create and implement social media strategies and content strategies for a portfolio of clients spanning a wide range of industries. Her team of creatives and strategists specializes in delivering innovative and integrated social media campaigns that drive conversions. Her work has been recognised with a wide range of awards, including the Irish Social Media Awards and Digital Media Awards.


