Digital Marketing - Study Notes:
Ad reporting and analysis is crucial to understanding how well ads are performing, and allows marketers make changes in real time to live ads to enhance their performance.
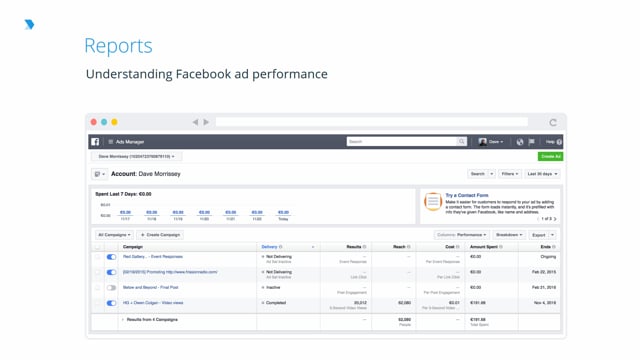
The best place to see how your ads are performing is the reports area of Ads Manager. Here you can create and export Facebook ad reports to see your most important ad metrics and learn how you're reaching your business goals. Ads Manager can also break down the performance of each campaign to date across all metrics. The ad performance metrics in your Ads Manager (impressions or clicks, for example) are updated in real-time.
In the table, you'll see data for your active campaigns, ad sets, or ads. To see data about specific campaigns, ad sets, or ads:
- Check the boxes next to them and then click
- Sort the data you see by clicking any of the column names (for example,Delivery).
- ClickExport and choose the format for your data.
- Choose the date range you want to use in your report by clicking theLast 30 Days dropdown in the top-right.
There are a range of metrics that can be analyzed in the Customize Columns tab in reporting in Ads Manager – these areas include:
- Delivery: See how many people you reached, how often, and at what costs.
- Engagement: See how many people liked, commented, and shared your ads, and the costs associated with the interactions.
- Video Views: See the amount of video views across a range of timescales, from three second views to 100% video completion, and more. The costs tied to each video view length are also included.
- App Engagement: See how many people installed your app from ads, their engagement in the app as a result of the ad, and the costs associated with it.
- Carousel Engagement: See the amount of clicks, click through rates, and costs of Carousel ads.
- Performance and Clicks: See all clicks, click through rates, and costs for all ad types.
- Cross Device: See the impact of ads on various objectives across desktop and mobile devices.
- Offline Conversions: See how many people took action off Facebook, and the costs.
- Targeting and Creative: See a breakdown of the performance of ads against the selected audiences.
- Messaging Engagement: See how many people started messaging with the business and the steps taken after like replying or purchasing.
- Bidding and Optimization: See the performance of bidding strategies and the actions taken by people as a result of ads across different events like ‘Add To Cart’ or ‘Purchasing’.
When you go to campaign-level reporting, you can get a snapshot of performance, the demographics of those who responded to your ads, and also which placement saw the most action.
At performance level you get a read of the actions against the objective you set. In this case it is conversions on the website. In terms of demographics, you get an age and gender split.
Customizing columns is a way to see more of the metrics you care about. For example, if you want to check your ad’s success through conversion tracking, you can customize the columns you're seeing to get that data. Choose from the Columns: Performance dropdown above your campaign table and click the column set to see specific metrics in your report.
Each report can be configured by date range, gender, device, placement, action, account, campaign, ad set, or individual ad. Here’s some details on the metric customization options available to you for reporting purposes:
- Performance: Can be customized further to include metrics like results, reach, frequency, and impressions.
- Engagement: Can be customized further to include metrics like Page likes, Page engagement, and post engagement.
- Videos: Can be customized further to include metrics like three-second video views and video watches at 25%.
- Website: Can be customized further to include metrics like website actions (all), checkouts, payment details, purchases, and adds to cart.
- Apps: Can be further customized to include metrics like app installs, app engagement, credit spends, mobile app actions, and cost per app engagement.
- Events: Can be further customized to include metrics like event responses and cost per event response.
- Clicks: Can be further customized to include metrics like clicks, unique clicks, CTR (click-through rate), and CPC (cost per click).
Settings: Can be further customized to include metrics like start date, end date, ad set name, ad ID, delivery, bid, and objective.
Back to TopDave Morrissey
Dave Morrissey is a Client Solutions Manager in the Retail and eCommerce division at Facebook. A seasoned digital marketer who specializes in social media, Dave now helps his clients achieve their marketing objectives through identity-based, data-driven marketing that's grounded in measurable business results.